
How the Internet Reshaped Shopping Forever
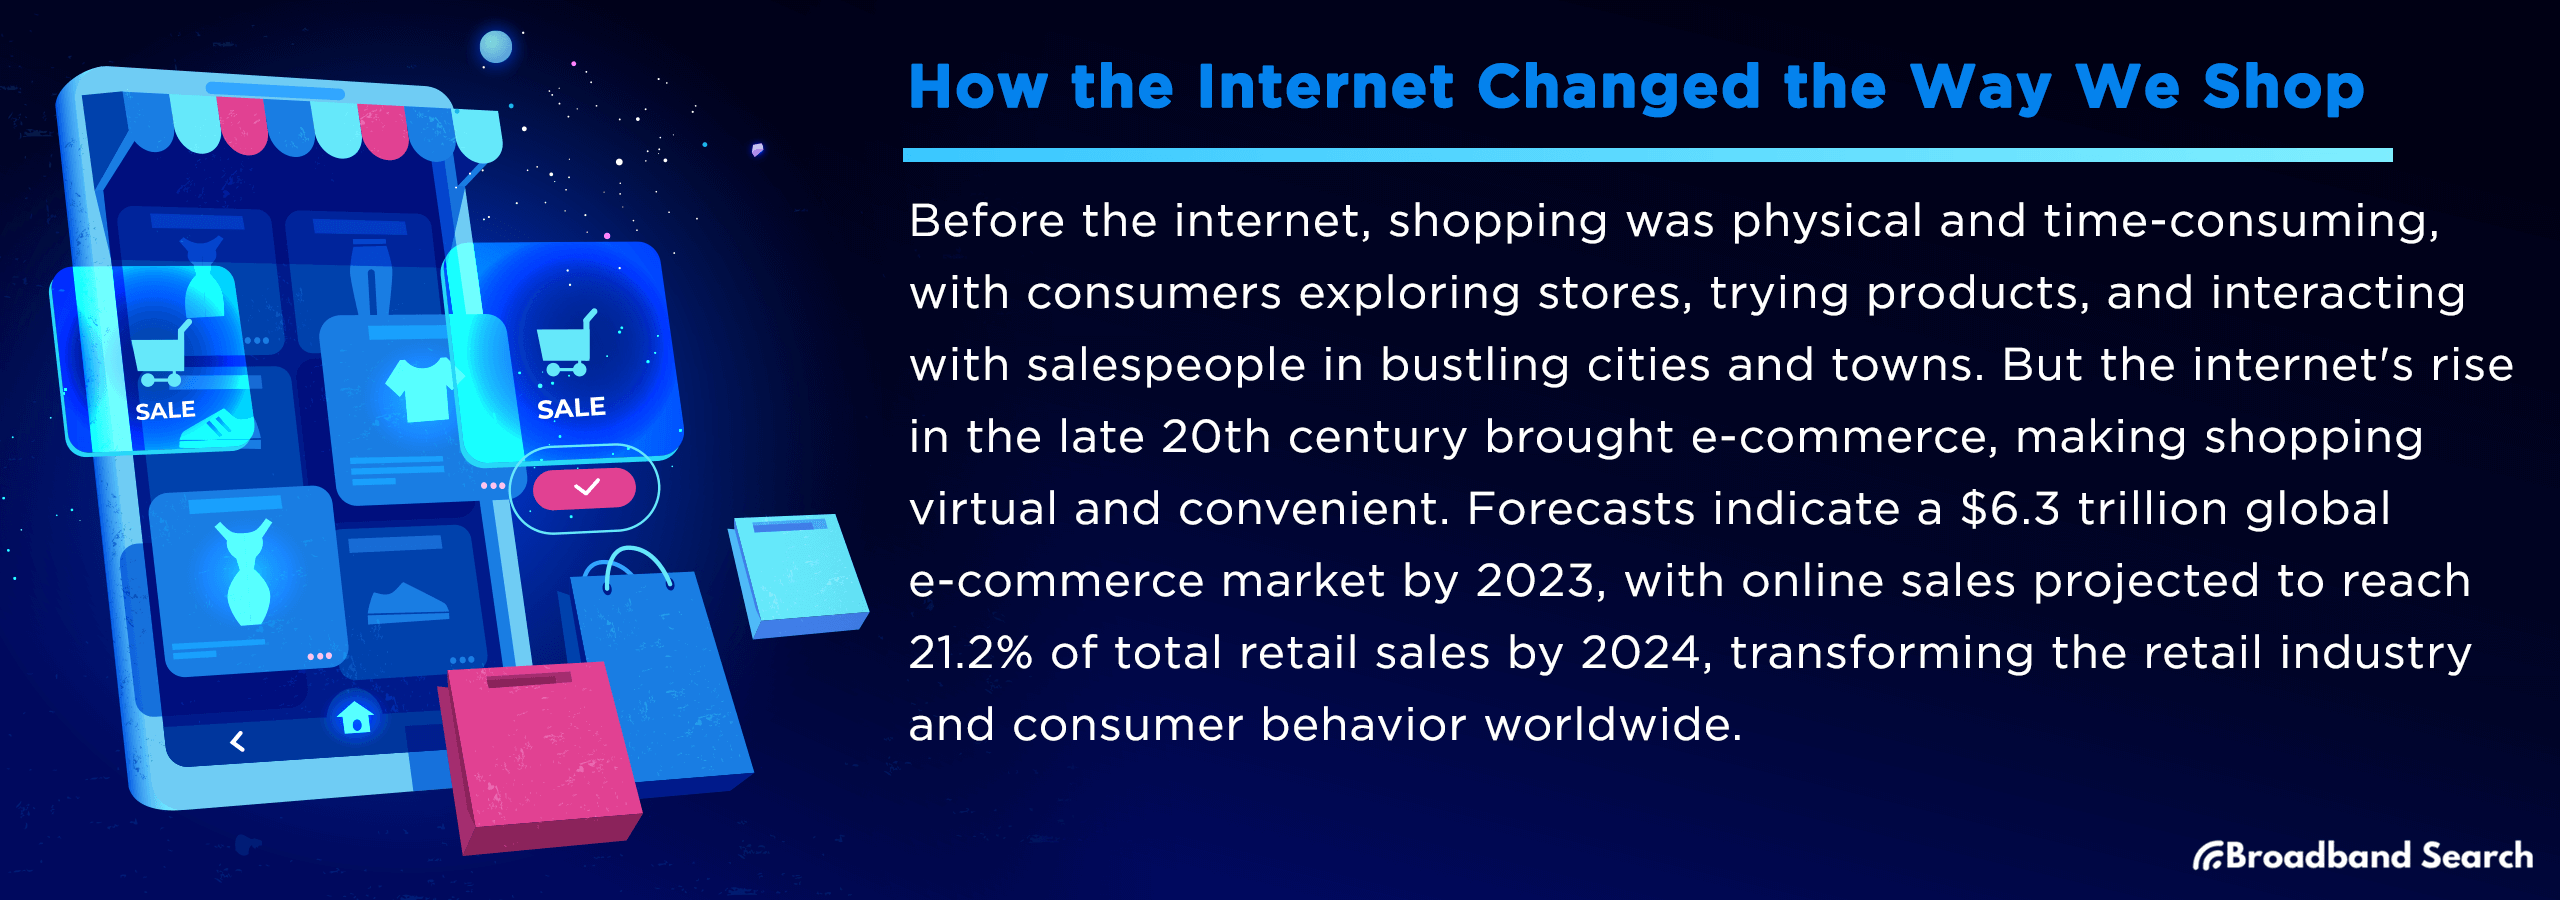
Remember flipping through mail-order catalogs? Or spending Saturday mornings at the mall? The internet didn't just add another way to shop—it fundamentally changed what we buy, how we buy it, and why we trust (or don't trust) the brands we choose.
By the third quarter of 2025, e-commerce accounted for 16.4% of all U.S. retail sales, according to the U.S. Census Bureau. That's an $310.3 billion industry in a single quarter. But the numbers only tell part of the story. The real transformation lies in how shopping moved from a physical errand to a digital habit—and what that shift means for consumers, retailers, and the economy.
According to the Pew Research Center, roughly three-quarters of U.S. adults now buy things online using a smartphone, and mobile purchasing continues to climb year over year. Shopping is no longer an errand—it's embedded into everyday life.
Key Takeaways
- E-commerce now represents 16.4% of total U.S. retail sales as of Q3 2025, with quarterly sales reaching $310.3 billion
- Physical stores still dominate, accounting for roughly 83.6% of retail, but online growth consistently outpaces in-store sales
- Consumer behavior has shifted toward price comparison, review-checking, and convenience-driven purchasing
- Returns have become normalized, changing how people approach online buying decisions
- Trust factors like reviews, transparent product information, and secure checkout experiences now drive purchasing confidence
From Catalog Orders to One-Click Checkout
Online shopping didn't feel inevitable in the beginning. It felt risky.
Shopping used to require time, transportation, and trust in what you could see and touch. The internet removed those barriers—but it also introduced new ones.
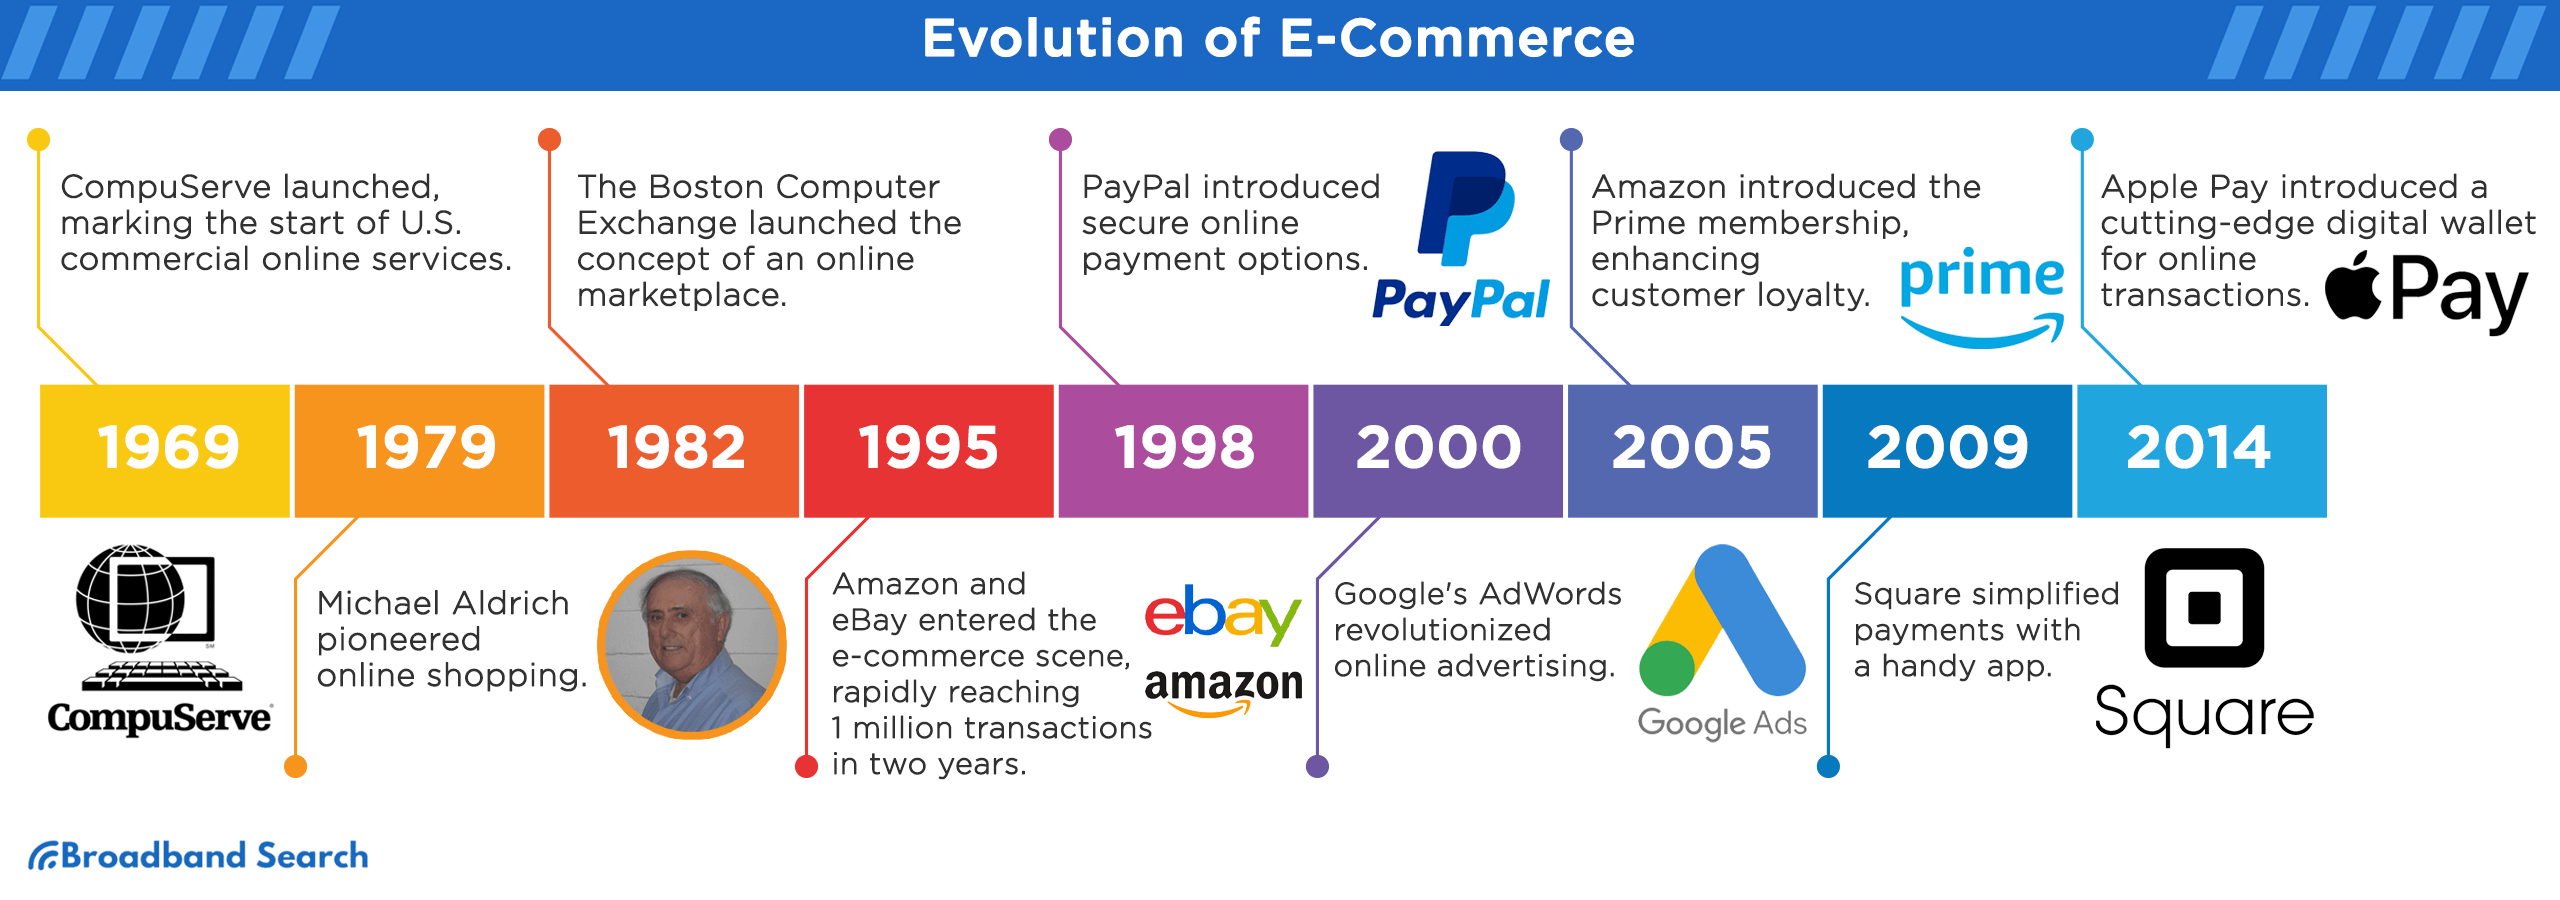
In the early days, buying online felt risky. Would the package arrive? Would the product match the description? Those concerns didn't vanish overnight but were solved through innovation. Secure payment systems like PayPal, customer reviews, and flexible return policies gave buyers confidence to click "purchase."
How Retail Sales Split Before and After E-commerce
According to historical data from the U.S. Census Bureau, e-commerce made up less than 1% of total retail sales in the late 1990s. By 2010, it had grown to roughly 4-5%. Today, it sits at 16.4%—a more than threefold increase in just 15 years.
But here's what often gets overlooked: total retail spending has grown. The internet didn't just redistribute existing sales—it created new spending habits. Subscription boxes, direct-to-consumer brands, and impulse purchases fueled by targeted ads all represent entirely new revenue streams that didn't exist in the pre-internet era.
And a major contributor to that shift was broadband internet. High-speed connectivity laid the groundwork for modern e-commerce, making secure transactions, real-time inventory updates, video product demos, and mobile checkout possible at scale. Without reliable infrastructure, none of this acceleration would have stuck.
The Economics of Convenience
Price comparison used to mean driving store to store. Now it means opening three browser tabs.
The internet made shopping radically more efficient. Consumers can compare prices across dozens of retailers in seconds, read product specifications without asking a salesperson, and make purchases without leaving the couch. For many households, especially those juggling work-from-home schedules or managing family obligations, that convenience is non-negotiable.
Fast Shipping Became the New Standard
Amazon Prime, launched in 2005, didn't just offer faster delivery—it reset expectations. Two-day shipping became the baseline. Now, same-day delivery is increasingly common in urban areas, and retailers without competitive shipping options struggle to compete.
This shift didn't happen in isolation. It required massive infrastructure investments: distribution centers, logistics networks, and partnerships with shipping carriers. The result? A retail landscape where speed matters as much as price.
For businesses needing reliable internet connectivity to manage e-commerce operations, explore how the right connection can support inventory systems, customer service platforms, and fulfillment processes.
Mobile Shopping Changed Where We Buy
Smartphones transformed shopping from a desktop activity to an anywhere, anytime habit. Whether it's checking prices while standing in a store aisle or ordering groceries from the couch, mobile access has made shopping seamlessly integrated into daily life.
According to TestMySpeed, mobile commerce is expected to account for 72% of all e-commerce sales globally by 2025. This shift in consumer behavior is driven by the convenience of shopping on-the-go and the growing availability of mobile payment systems.
Seamless mobile shopping also depends on having enough speed to handle image-heavy product pages, secure checkout systems, and real-time payment processing without lag.
The Trust Layer: Reviews and Transparency
One of the internet's biggest contributions to shopping wasn't technology—it was information.
Reviews Became the New Word-of-Mouth
Before the internet, recommendations came from friends, family, or salespeople. Now, they come from strangers who've already bought the product. Star ratings, detailed reviews, and Q&A sections give shoppers insight that was previously impossible to access.
This transparency has forced retailers to prioritize quality and customer service. A single wave of negative reviews can sink a product launch. Conversely, authentic positive feedback can turn an unknown brand into a bestseller overnight.
Product Information Got Detailed (and Comparable)
Online retailers provide specifications, size charts, ingredient lists, and compatibility details that would be impossible to display in a physical store. Shoppers can zoom in on product images, watch demonstration videos, and compare features side-by-side.
For businesses, this transparency is a double-edged sword. It builds trust, but it also means there's nowhere to hide subpar products or misleading marketing.
And as product pages grow more detailed and transactions more frequent, shoppers are sharing more personal and payment data than ever. Avoiding unsecured public WiFi and maintaining a secure home network have quietly become part of buying online.
The Rising Cost of Digital Trust
Reviews and transparency helped normalize online shopping — but trust online is still fragile.
A 2025 Pew Research Center survey found that roughly one-third of Americans say they’ve experienced an online shopping scam. As e-commerce expands, so do fake storefronts, fraudulent listings, and phishing attempts designed to look legitimate.
The same tools that make buying easy — fast checkout, social ads, one-click purchasing — also make deception easier. As online shopping became routine, digital literacy became part of the transaction. Verifying sellers, checking URLs, and securing your connection are now basic consumer habits.
Trust still drives e-commerce. But today, it’s something shoppers evaluate — not assume.
The Influencer Economy and Social Commerce
Shopping and social media have become inseparable.
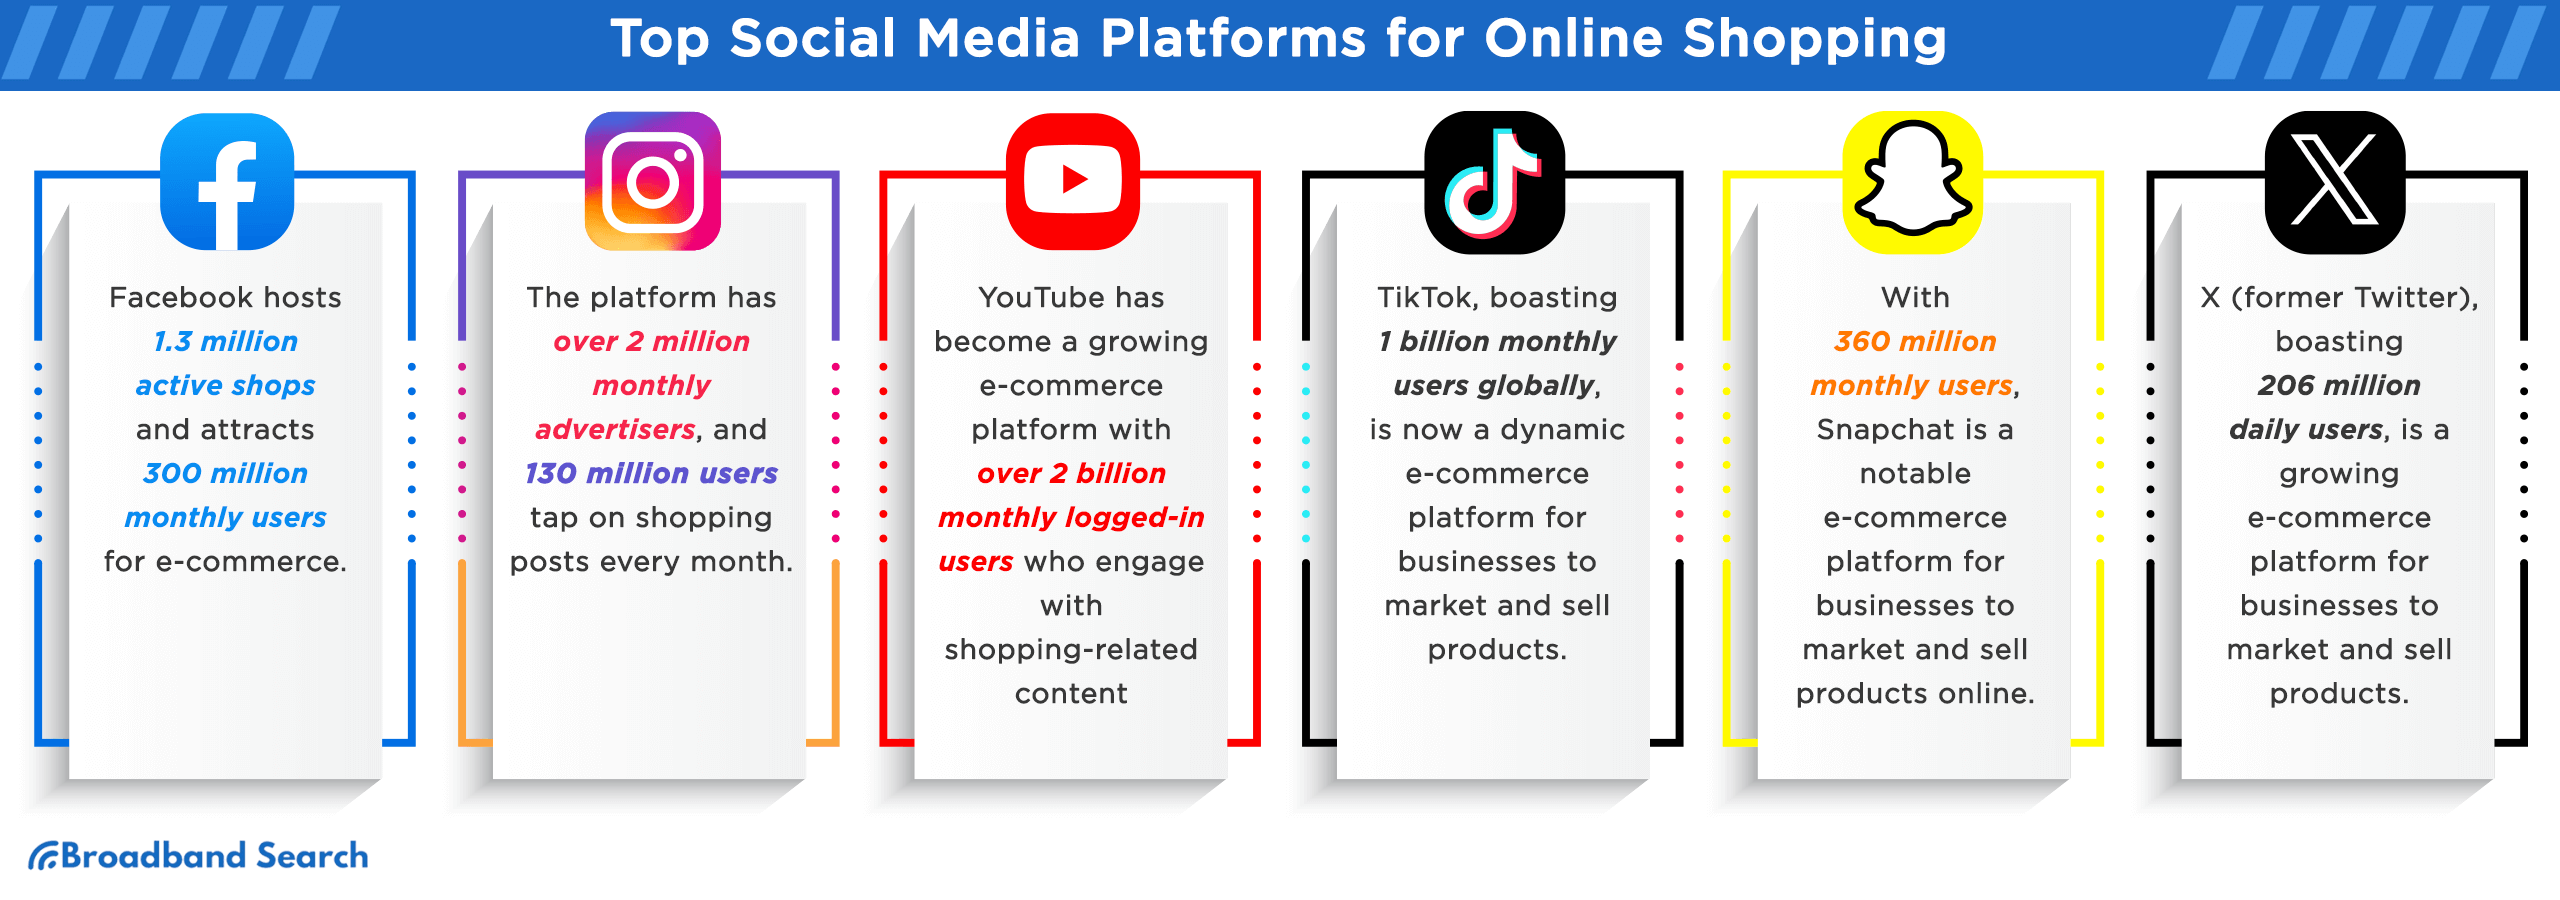
Influencers, affiliate marketers, and brand partnerships now drive billions in sales. A single product recommendation from a trusted creator can generate more conversions than a traditional ad campaign. Platforms like Instagram, TikTok, and YouTube have integrated shopping features directly into their interfaces, allowing users to purchase without ever leaving the app.
This shift has democratized marketing. Small brands can reach massive audiences without multimillion-dollar ad budgets. But it's also created challenges around authenticity—distinguishing genuine recommendations from paid promotions isn't always straightforward.
Affiliate Marketing Shaped How We Discover Products
Amazon's affiliate program, launched in 1996, pioneered a model that now spans the entire internet. Bloggers, reviewers, and comparison sites earn commissions by directing traffic to retailers. This incentivized the creation of detailed buying guides, product comparisons, and niche content that helps consumers make informed decisions.
Which is why we’ve seen over the past 2 decades, online behavior has evolved alongside e-commerce growth.
The Returns Problem
One unintended consequence of convenient online shopping? A surge in returns.
Shoppers have embraced "buy-to-try" behavior—ordering multiple sizes or colors with the expectation of returning what doesn't work. Retailers responded with free return shipping and extended return windows to stay competitive. But this convenience comes at a cost.
Returned items often can't be resold as new. Some end up in liquidation channels or, worse, landfills. The environmental and financial impact of reverse logistics is significant, and it's a challenge the industry is still working to solve.
The shift toward digital consumption extends beyond physical goods. Streaming services and bundled entertainment packages changed how households evaluate subscriptions, compare value, and manage recurring expenses — a pattern that reflects the same convenience-first mindset driving online retail.
What's Next: AI and Personalization
The next wave of online shopping innovation is already here: artificial intelligence.
AI-powered recommendation engines analyze browsing behavior, purchase history, and even social media activity to suggest products tailored to individual preferences. Virtual try-on tools use augmented reality to show how clothes, glasses, or furniture will look before you buy. Chatbots handle customer service inquiries instantly.
These technologies make shopping faster and more personalized, but they also raise questions about data privacy and algorithmic bias. As AI becomes more embedded in the shopping experience, consumers will need to weigh convenience against control over their personal information.
For businesses looking to optimize their online operations, reliable connectivity is essential. The right connection supports e-commerce platforms, inventory management, and customer service tools.
The Internet Reinvented The Shopping Experience
The internet didn't replace shopping—it reinvented it. Physical stores still matter, but they now compete in an ecosystem where convenience, transparency, and personalization set the standard. Consumers have more choices, more information, and more control than ever before.
But with that power comes complexity. Navigating endless options, distinguishing trustworthy reviews from fake ones, and managing the environmental impact of returns are challenges that didn't exist a generation ago. The internet made shopping easier in many ways, but it also made it more complicated.
As e-commerce continues to evolve, the question isn't whether online shopping will grow—it's how consumers, retailers, and regulators will shape what comes next.
FAQ
How much of retail shopping is online now?
As of Q3 2025, e-commerce accounts for 16.4% of total U.S. retail sales, according to the U.S. Census Bureau. That represents $310.3 billion in a single quarter.
When did online shopping really take off?
E-commerce gained traction in the late 1990s with the launch of Amazon and eBay, but it didn't become mainstream until the 2000s. The COVID-19 pandemic (2020-2022) accelerated adoption, making online shopping a default habit for millions of households.
What's happening to physical retail stores?
Brick-and-mortar stores still account for the majority of retail sales (83.6% as of Q3 2025), but many are adopting omnichannel strategies—combining online ordering with in-store pickup, same-day delivery, and seamless return options—to stay competitive.
How has consumer behavior changed?
Shoppers now prioritize convenience, price comparison, and peer reviews over traditional advertising. Mobile shopping has become the norm, and expectations around fast, free shipping have fundamentally reshaped the retail experience.
What role do reviews play in online shopping?
Reviews have become one of the most trusted sources of product information. Detailed feedback from other buyers influences purchasing decisions more than brand messaging, and platforms have implemented verification systems to combat fake reviews.
What is the environmental impact of online shopping?
Increased returns, excess packaging, and last-mile delivery contribute to environmental concerns. The retail industry is exploring sustainable solutions, but the "buy-to-try" culture has created significant waste challenges.
How is AI changing online shopping?
AI powers personalized product recommendations, virtual try-on tools, and chatbot customer service. These technologies make shopping more efficient but raise questions about data privacy and algorithmic transparency.